Search Colleges, Exams, Schools & more


Login
The MBA Seats IITs Can’t Seem to Fill, A Growing Red Flag
Over the years, the Departments of Management Studies at IITs have been trying to position themselves as an alternative to the IIMs when it comes to pursuing management education. These programmes attract students who want a blend of technology, analytics, and management under a single roof.
This Story also Contains
- A struggle to fill the seats
- 100% Placement on Admitted Students but Not on Intake?
- A Comparison That MBA Aspirants Cannot Ignore
- How MBA Aspirants Should Interpret This Data
- Rise in Vacant Seats: a warning sign?
.jpg)
However, a glance at the data on admissions, seat vacancies, intake, and placement outcomes across IITs and IIMs reveals a widening gap in market perception, trust in the program, and actual placement numbers. These numbers are extremely critical for MBA aspirants, especially those who are planning to make their admission decisions based on brand value, return on investment and career stability.
This article studies the data in context and with direct relevance for MBA aspirants.
A struggle to fill the seats
Market perception has played a significant role in the number of students admitted to MBA programs across IITs. In the past three years, there has been a consistent rise in the number of vacant MBA seats.
Compare this with IIMs, where vacant seats are almost non-existent.
Vacant Seats at IIT DoMS (Delhi)
Over three years, IIT Delhi’s DoMS saw its vacancy rate increase dramatically:
Year | Intake | Admitted | Vacant Seats | Vacancy % |
|---|---|---|---|---|
2020–21 | 144 | 117 | 27 | 18.75% |
2021–22 | 144 | 128 | 16 | 11.11% |
2022–23 | 144 | 93 | 51 | 35.42% |
Observation: The 2022–23 cycle shows one in three seats left vacant at one of India’s most prestigious institutes.
IIT Kharagpur (VGSOM): Vacancy Jumps From 2% to 39%
In 2022–23, the institute increased its intake from around 100 to 206. However, the number of admitted students did not increase in proportion in comparison to previous years. 81 seats remained unfilled.
| Year | Intake | Admitted | Vacant Seats | Vacancy % |
|---|---|---|---|---|
2020–21 | 99 | 97 | 2 | 2.02% |
2021–22 | 101 | 94 | 7 | 6.93% |
2022–23 | 206 | 125 | 81 | 39.32% |
Observation: The 2022-23 cycle saw the steepest vacancy increases across all IITs.
IIT Bombay (SJMSOM): Vacancy Remains Highly Volatile
SJMSOM’s vacancy jumped to its highest level in recent times:
| Year | Intake | Admitted | Vacant Seats | Vacancy% |
|---|---|---|---|---|
2020–21 | 182 | 148 | 34 | 18.68% |
2021–22 | 182 | 115 | 67 | 36.81% |
2022–23 | 182 | 114 | 68 | 37.36% |
Observation: The intake consistently stays at 182 seats, but admissions stay stuck far below.
100% Placement on Admitted Students but Not on Intake?
We often find claims of 100 per cent placements. Although this is technically true, but it can be misleading as the calculation is based on the number of students who are admitted in the programme and not the number of seats available. This leads to vacant seats being excluded, which creates a perception of a higher placement success than what the full seat capacity suggests.
The More Accurate Metric: Placement % on Total Intake
IITs
In the academic year 2022-23, IITs reflected high placement rates when it comes to admitted students, but once we bring sanctioned intake in the equation, the picture changes dramatically as the majority of the IITs fall between 55-65 per cent, with exceptions being IIT Madras and IIT Roorkee.
| Institute | Placement% on Admitted | Placement % on Intake |
|---|---|---|
IIT Delhi | 95.70% | 61.81% |
99.20% | 60.19% | |
96.51% | 86.46% | |
97.37% | 60.99% | |
96.34% | 83.16% | |
81.48% | 55.00% | |
78.67% | 64.13% |
Observation: The average placement percentage on intake for the IITs is around 67.39%
IIMs
In 2022–23, top IIMs recorded near-perfect admissions and placements, with almost no vacant seats and placement rates consistently above 97 per cent. This reflects strong demand, full utilisation of seats, and placement reliability across the leading IIMs.
Institute | Intake | Admitted | Placed | Vacancy | Placement % on Admitted | Placement % on Intake |
|---|---|---|---|---|---|---|
444 | 444 | 434 | 0.00% | 97.75% | 97.75% | |
525 | 525 | 517 | 0.00% | 98.48% | 98.48% | |
562 | 547 | 547 | 2.67% | 97.33% | 97.33% | |
621 | 614 | 614 | 1.13% | 98.87% | 98.87% | |
536 | 536 | 536 | 0.00% | 100.00% | 100.00% | |
540 | 540 | 528 | 0.00% | 97.78% | 97.78% |
Observation: Top IIMs had almost full intake and almost 100 per cent placement. In the academic year 2022-23 the vacant seats remained below three per cent. IIM Lucknow, Calcutta and Mumbai also showed negligible or zero vacancies. This data clearly indicates that the demand for IIM programmes remains exceptionally strong and consistent.
A Comparison That MBA Aspirants Cannot Ignore
| Details | IIT DoMS (7 institutes) | IIMs (21 institutes) |
|---|---|---|
Sanctioned Intake | 895 | 8091 |
Admitted | 629 | 8017 |
Vacancy % | 29.72% | 0.91% |
Graduated | 615 | 7793 |
Placed | 589 | 7728 |
Total Placement | 99.33% | 99.73% |
Placement % (Admitted) | 93.64% | 96.40% |
Placement % (Intake) | 65.81% | 95.53% |
Observations: If we study the table, we can see that IIMs have nearly full capacity. This shows a strong demand from aspirants (admitted) as well as employers (placed). However, when it comes to IITs the placement percentage on intake is almost 30 per cent lower than that of IIMs. So when it comes to management education, both students as well as companies prefer and trust IIMs more.
How MBA Aspirants Should Interpret This Data
As an MBA candidate, your goal is not only to get admitted but also to graduate into a strong peer cohort, solid corporate network, and predictable placement system.
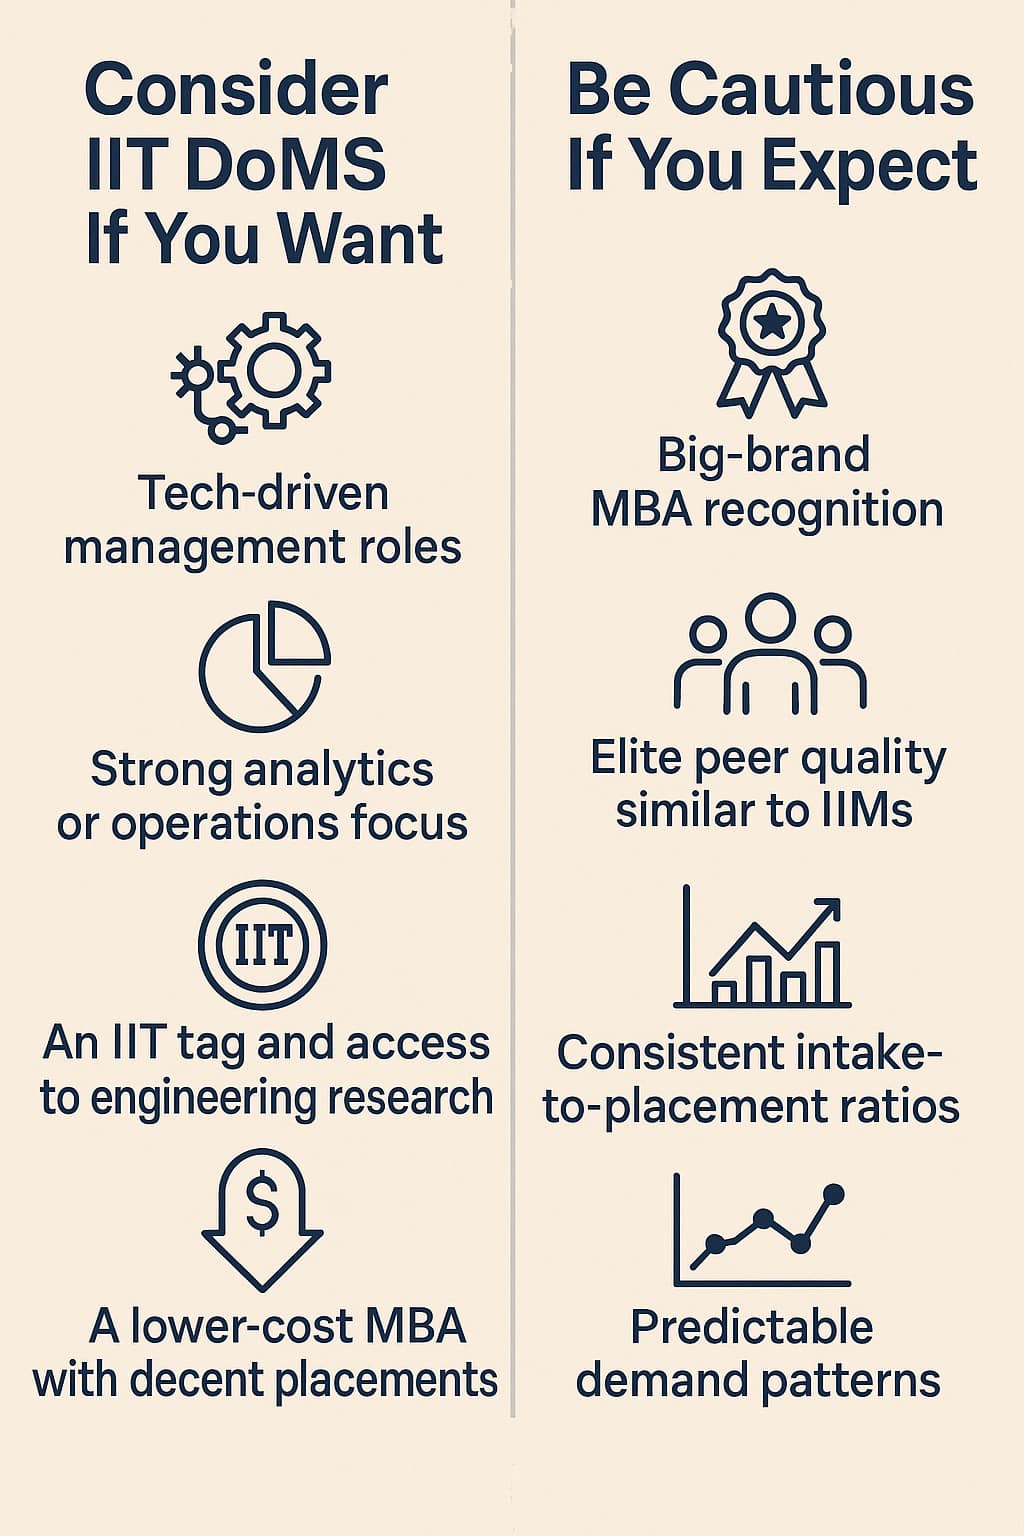
Rise in Vacant Seats: a warning sign?
When it comes to MBA programmes from IITs, they still fall short of IIMs, if we consider market trust, seat stability, and consistent outcomes. Increasing vacancies, weaker placements when measured on intake, and yearly fluctuations signify a visible credibility gap. IIMs set a benchmark, whereas IITs offer more niche value. Aspirants should look at more than just brochures; they should study the data that we have provided and then align their decision with their long-term career goals, rather than just go for branding.
Articles
Related Stories
|
Upcoming Bschool Exams

Certifications By Top Providers
Explore Top Universities Across Globe
Popular Courses and Specializations
List of colleges accepting CAT
Browse Bschool Colleges by State
Questions related to CAT
On Question asked by student community
Have a question related to CAT ?
Hello Dear Student,
An SC rank of 82 in a Common Entrance Test (CET) is highly competitive and typically guarantees admission into top-tier state universities, central universities, or highly-ranked private institutions. Whether a specific seat is currently available depends directly on the exact university's counselling schedule. Many institutes require you
Hello Dear Student,
With a score of 265, securing a B-Category (Management)
MBBS
seat is highly competitive, but not entirely impossible. Closing scores for these seats typically fall between 225 and 350, depending on the state and college. Waiting for the mop-up round can sometimes lower the cutoff as unallocated
If by OC you mean Open Category/General category in India, and you have 95%+ throughout your academics (Class 10, Class 12, and graduation) , then your CAT percentile target depends on the B-schools you're aiming for.
Here's a general guideline:
| Target B-school | Safe CAT Percentile (General Category) |
|---|---|
| Indian Institute of |
Hello,
Getting an MBBS seat in Karnataka with 460 marks is quite difficult, even if you belong to Category 1, Ex-serviceman, and HK category in government colleges. However, you have a good chance of getting a seat in the private medical colleges through the government-quota seats in private medical colleges.
Hello Dear Student,
Yes, you have a very strong chance of securing a 'Category-A' (convenor quota) BDS seat at the Panineeya Institute of Dental Sciences in Hyderabad with 377 marks.
You can check, find and access more information here:
https://medicine.careers360.com/articles/re-neet-2026-safe-score-for-bds
Hope it helps!
Popular CAT Questions
Directions for question:
The bar-graph given below shows the foreign exchange reserves of Nepal (in million Rupees) from 2014 to 2021. Answer the following questions based on the graph :

Question:
What was the percentage increase (rounded to the nearest integer, if deemed necessary) in the foreign exchange reserves in
MBA/PGDM Admissions OPEN
Last Date to Apply: 15th July | Ranked #36 amongst institutions in Management by NIRF | 100% Placement
IBSAT 2026-ICFAI Business School MBA/PGPM 2027
ApplyNAAC A++ Grade | AACSB Accredited | 75,000+ Alumni
Amity University-Noida MBA Admissions 2026
ApplyRanked among top 10 B-Schools in India by multiple publications | Top Recruiters-Google, MicKinsey, Amazon, BCG & many more.
GITAM University Admissions 2026
ApplyApplication End Date: 24th Jul'26 | AICTE Approved | NAAC A++ | Category 1 University by MHRD | Highest CTC 1.4 Cr LPA from Amazon
Integral University MBA Admissions 2026
ApplyNAAC A+ Accredited | Highest CTC 45 LPA | Scholarships Available
Dolphin PG Institute MBA Admissions 2026
Apply10000+ Alumni across the globe | Scholarships available
CAT Notifications
Never miss CAT update
Get timely CAT updates directly to your inbox. Stay informed!