Amity University-Noida MBA Admissions 2026
Ranked among top 10 B-Schools in India by multiple publications | Top Recruiters-Google, MicKinsey, Amazon, BCG & many more.


Preparation for the CAT 2025 exam demands a solid hold on all three sections, and one of the toughest among them is the Data Interpretation and Logical Reasoning (DILR) section. Renowned for its unexpected question types and time-consuming nature, DILR is a section that contributes significantly to overall percentile. To enable aspirants to boost their preparation, the article presents a collection of well-chosen CAT DILR sample questions with proper solutions, which are similar to the exam's level of difficulty and question patterns. Students will be able to enhance their analytical reasoning, speed, and accuracy—essential skills required to master the CAT through practice with these questions.
This Story also Contains

Directions: Study the table and answer the questions that follow.
Year | Sedans | SUVs | Hatchbacks | Sports Cars |
2018 | 750 | 350 | 400 | 120 |
2019 | 820 | 380 | 420 | 110 |
2020 | 900 | 420 | 460 | 130 |
2021 | 950 | 450 | 490 | 490 |
2022 | 1000 | 480 | 520 | 150 |
1. Question:
Which is the least manufactured car type in 2022?
Sedans
SUVs
Hatchbacks
Sports Cars
Ranked among top 10 B-Schools in India by multiple publications | Top Recruiters-Google, MicKinsey, Amazon, BCG & many more.
Last Date to Apply: 31st July | Ranked #36 amongst institutions in Management by NIRF | 100% Placement
Answer: 4
To determine the least manufactured car type, we can examine the production numbers for each type of car across all years and identify the type with the lowest total production.
Here are the total productions for each type of car:
- Sedans: 1000 (in 2022)
- SUVs: 480 (in 2022)
- Hatchbacks: 520 (in 2022)
- Sports Cars: 150 (in 2022)
The least manufactured car type is "Sports Cars" with a total production of 150 in 2022. Therefore, Sports Cars are the least manufactured car type.
2. Question:
What is the average production of all car types in 2022?
537.50
538.75
540.20
545.60
Answer: 1
Total production in 2022 = Production of Sedans + Production of SUVs + Production of Hatchbacks + Production of Sports Cars
Total production in 2022 = 1000 (Sedans) + 480 (SUVs) + 520 (Hatchbacks) + 150 (Sports Cars) = 2150
Average production in 2022 = Total production in 2022 / Number of car types = 2150 / 4 = 537.5
So, the average production of all car types in 2022 is 537.5.
3. Question:
The production of sports cars in the year 2022 was what per cent of the production of SUVs in the year 2021?
20%
25%
33.33%
40%
Answer: 3
To find the percentage of the production of Sports Cars in 2022 compared to the production of SUVs in 2021,
Percentage = (Value 1 / Value 2) × 100
Value 1 (Sports Cars in 2022) = 150
Value 2 (SUVs in 2021) = 450
Percentage = (150 / 450) × 100
Percentage = (1/3) × 100
Percentage = 33.33%
So, the production of Sports Cars in the year 2022 was 33.33% of the production of SUVs in the year 2021.
4. Question:
Calculate the percentage increase in the manufacture of hatchbacks from 2018 to 2022
25%
30%
35%
40%
Answer: 2
Percentage Increase = [(New Value - Old Value) / |Old Value|] × 100
Old Value (2018) = 400
New Value (2022) = 520
Percentage Increase = [(520 - 400) / |400|] × 100
Percentage Increase = (120 / 400) × 100
Percentage Increase = 30%
The percentage increase in the manufacture of Hatchbacks from 2018 to 2022 is 30%.
5. Question:
Which type of car type was manufactured maximum between 2019 and 2021
Sedans
SUVs
Hatchbacks
Sports Cars
Answer: 1
To determine which type of car was manufactured the most between 2019 and 2021, the sum of the production of each type of car for those years must be calculated and the maximum is chosen.
Let's calculate the total production for each type of car between 2019 and 2021:
For Sedans:
- 2019: 820
- 2020: 900
- 2021: 950
Total Sedans manufactured from 2019 to 2021: 820 + 900 + 950 = 2670
For SUVs:
- 2019: 380
- 2020: 420
- 2021: 450
Total SUVs manufactured from 2019 to 2021: 380 + 420 + 450 = 1250
For Hatchbacks:
- 2019: 420
- 2020: 460
- 2021: 490
Total Hatchbacks manufactured from 2019 to 2021: 420 + 460 + 490 = 1370
For Sports Cars:
- 2019: 110
- 2020: 130
- 2021: 140
Total Sports Cars manufactured from 2019 to 2021: 110 + 130 + 140 = 380
So, among these types of cars, Sedans were manufactured the most between 2019 and 2021, with a total of 2670 units.
Direction: Study the bar graph below and answer the questions that follow:
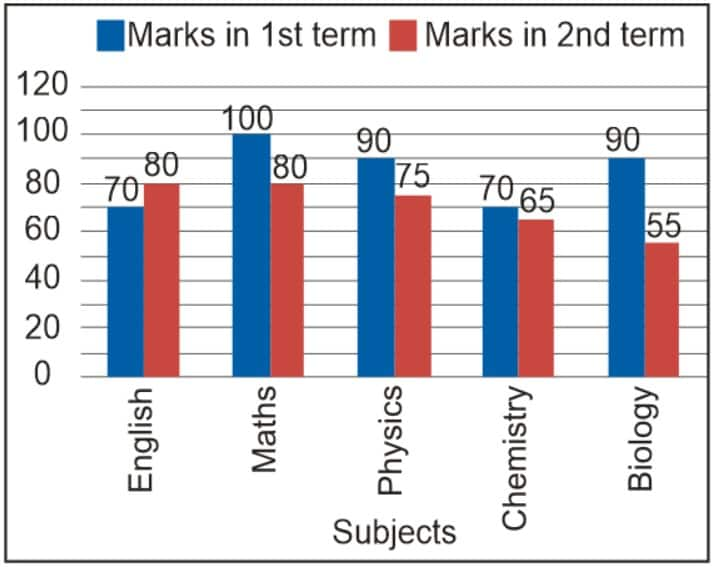
6. Question:
In which subject does the total in both terms add up to 145?
Chemistry
Biology
English
Mathematics
Answer: 2
We can see that,
Marks obtained in Biology in term 1 = 90
Marks obtained in Biology in term 2 = 55
Total marks obtained in Biology in both the terms = 90+55
= 145
7. Question:
The difference in marks obtained in both the terms by the students is minimal in:
Chemistry
Biology
English
Mathematics
Answer: 1
Marks obtained in Chemistry in term 1 = 70
Marks obtained in Chemistry in term 2 = 65
Difference in both = 70 - 65
= 5
We can see that the difference in marks obtained in both the terms by the students is minimal in Chemistry.
8. Question:
Find the average marks obtained in Physics
62.5
72.5
82.5
92.5
Answer: 3
Marks obtained in Physics in term 1 = 90
Marks obtained in Physics in term 2 = 75
Average marks obtained in English = 90+75/2
= 165/2
= 82.5
9. Question:
Find the ratio of average marks obtained in English to average marks obtained in Maths
16:15
5:6
11:12
12:11
Answer: 2
Marks obtained in English in term 1 = 70
Marks obtained in English in term 2 = 80
Average marks obtained in English = 70+80/2
= 150/2
= 75
Marks obtained in Maths in term 1 = 100
Marks obtained in Maths in term 2 = 80
Average marks obtained in English = 100 + 80/2
= 180/2
= 90
The ratio of average marks obtained in English to average marks obtained in Maths = 75: 90
= 5: 6
10. In a survey of 80 customers at a restaurant, 50 liked Italian cuisine, 40 preferred Mexican dishes, and 30 enjoyed Asian food. Of the customers, 20 liked both Italian and Mexican, 15 liked both Mexican and Asian, and 10 liked both Italian and Asian. How many customers do not prefer Italian Cuisine?
33 customers
35 customers
30 customers
40 customers
Answer: 3
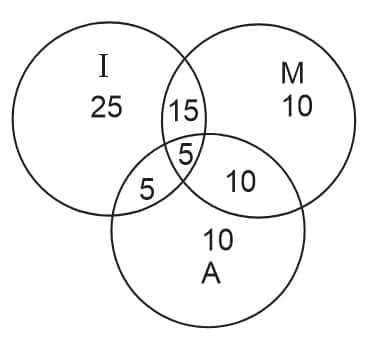
To find the number of customers who do not like Italian cuisine, we have to add the values of customers who prefer Mexican and Asian food or ignore all values that come under set I.
Here, the number of customers who do not like Italian cuisine = 10 + 10 + 10
= 30
Consider the following pie chart and answer the questions that follow.
In a survey conducted among 2000 tourists asking them about their favourite tourist destinations, all of them answered and the response is displayed on the below pie chart.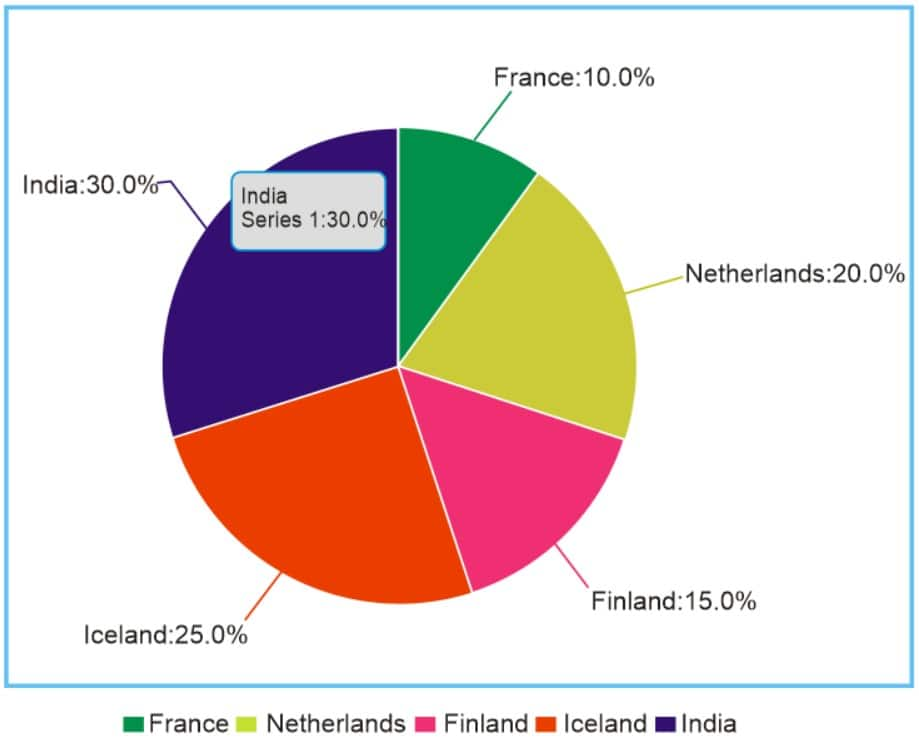
11. How many people only travel to European countries?
500
700
1200
1400
Answer: 4
Percentage of people who only travel to European countries = (Percentage of France + Percentage of Netherlands + Percentage of Finland + Percentage of Iceland)
Percentage of people who only travel to European countries = (10% + 20% + 15% + 25%) = 70%
Number of people who only travel to European countries = (70% of 2,000)
Number of people who only travel to European countries = 0.70 × 2,000 = 1,400 people
12. How many people do not want to go to the Netherlands?
200
400
1600
800
Answer: 3
Given:
Netherlands:
20
%
20% of 2,000 tourists
Number of tourists who do not want to go to the Netherlands = Total number of tourists - Number of tourists who chose the Netherlands
Number of tourists who do not want to go to the Netherlands = 2,000 - (20% of 2,000)
Number of tourists who do not want to go to the Netherlands = 2,000 - (0.20 × 2,000)
Number of tourists who do not want to go to the Netherlands = 2,000 - 400
Number of tourists who do not want to go to the Netherlands = 1,600
13. Which is the least preferred country?
India
Netherlands
Finland
France
Answer: 4
Given the percentage of tourists and their favourite destinations:
India: 30%
France: 10%
Netherlands: 20%
Finland: 15%
Iceland: 25%
The least preferred country is France with 10% of tourists choosing it as their favourite destination, and the most preferred country is India.
14. How many of them preferred to go to India?
240
420
600
360
Answer: 3
Number of tourists who preferred to go to India = 30% of 2,000 = 0.30 × 2,000 = 600.
So, 600 tourists preferred to go to India among the 2,000 tourists.
Direction:
In a circular table arrangement with 6 persons facing towards the centre, the following information is known:
Tom sits second to the right of Peter.
Quill and Umair sit opposite each other.
Shawn does not sit adjacent to Umair or Peter.
Reena is also sitting with Peter.
15. Question:
Who are your immediate neighbours of Shawn?
Umair and Peter
Quill and Reena
Tom and Quill
Umair and Reena
Answer: 3
Consider the only possible circular arrangement of persons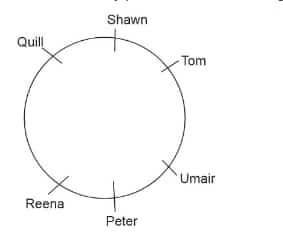
From the above arrangement, it can be seen that Shawn sits in between Quill and Tom and hence the immediate neighbours of Shawn are Quill and Tom.
Direction: A cubical block of wood is coloured on all the faces using two colours red and yellow, so that each face is coloured with only one colour, and a minimum of three faces are of the same colour. Then the cube is diced with coplanar and non-concurrent cuts of a knife the minimum number of times to create 729 identical small cubes.
16. Question:
If the whole cube were to be covered with a single layer of green-coloured small cubes, identical in size to the 729 small cubes obtained by dicing, how many green-coloured small cubes were required?
81
294
486
602
Answer: 4
The original cube was (9 × 9 × 9) dimensioned cube, taking into consideration the 729 identical small cubes it was diced into.
If the whole cube were to be covered with a single green-coloured small cube, identical in size to the 729 small cubes obtained by dicing, the dimension would become (11 × 11 × 11).
Thus, the number of gree-coloured small cubes required = (11)3 – (9)3 = 1331 – 729 = 602
Hence, the fourth option is correct.
Directions: The following questions are based on the information given below:
1. A cuboid-shaped wooden block has 10 cm length, 8 cm breadth, and 1 cm height.
2. Two faces measuring 10 cm × 1 cm are coloured in blue.
3. Two faces measuring 8 cm × 1 cm are not coloured.
4. Two faces measuring 10 cm × 8 cm are coloured in Pink.
5. The block is divided into small cubes of 1 cm × 1 cm × 1 cm.
17. Question:
How many cubes will have pink colour on two sides and the rest of the four sides having no colour?
24
48
8
32
Answer: 2
Except for boundary cubes, all other cubes on the face 10 cm × 8 cm will satisfy this condition.
The total cubes will be 80 and the boundary cubes will be 32.
So, the remaining cubes = 80 – 32 = 48
Hence, the second option is correct.
Directions: In an institute, there are three top rankers in a batch, Karthik, Waheeda, and Ritesh, not necessarily in the same order, who made the following statements about their ranks.
Karthik:
(A) I am not the top ranker.
(B) Waheeda is not the second ranker.
(C) Ritesh is the third ranker.
Waheeda:
(A) Karthik’s first statement is false.
(B) I am the third ranker.
(C) I made two false statements.
Ritesh:
(A) Karthik is the first ranker.
(B) Waheeda is not the second ranker.
(C) I am the second ranker.
It is known that each of Karthik and Ritesh made only one false statement. Waheeda made only one true statement.
18. Question:
Which statement of Karthik and Ritesh is True?
1
2
3
None
Answer: 2
It is given that Waheeda made only one true statement. It implies that she made two false statements.
⇒ Waheeda’s third statement is true and the other two are false.
⇒ Karthik’s first statement is true. (From Waheeda’s first statement) i.e. Karthik is not the top ranker.
⇒ Ritesh’s first statement is false and the other two are true.
⇒ Ritesh is the second ranker and Waheeda is not the second ranker. As Karthik is not the first ranker, Waheeda is the first ranker and Karthik is the third ranker.
⇒ Karthik’s second statement is true and the third one is false.
Therefore, statement 2 is true of Karthik and Ritesh. Hence, the second option is correct.
19. Question:
If Waheeda’s statements are not considered, which of the following represents the correct order of truth and false statements made by Ritesh so that the rank of all three will not alter?
True, False, True
True, True, False
False, True, True
Cannot be determined
Answer: 3
It is given that Waheeda made only one true statement. It implies that She made two false statements.
⇒ Waheeda’s third statement is true and the other two are false.
⇒ Karthik’s first statement is true. (From Waheeda’s first statement) i.e. Karthik is not the top ranker.
⇒ Ritesh’s first statement is false and the other two are true.
⇒ Ritesh is the second ranker and Waheeda is not the second ranker. As Karthik is not the first ranker, Waheeda is the first ranker and Karthik is the third ranker.
⇒ Karthik’s second statement is true and the third one is false.
Therefore, the arrangement is as follows:
Waheeda > Ritesh > Karthik
If Waheeda’s statements are not considered, then the correct order of truth and false statements made by Ritesh are False, true, and true. Hence, the third option is correct.
Direction: In a school quiz competition, there are 10 teams, and each team competes against each of the other teams exactly once. In this scoring system, each win is worth 3 points, a draw is worth 1 point, and a loss is worth (–1) points. The final standings are as follows:
Team Phoenix – 27 points
Team Tiger – 18 points
Team Falcon – 14 points
Team Lion – 10 points
Team Dolphin – 8 points
Team Wolf – (–9) points
Team Eagle – 5 points
Team Bear – 4 points
Team Panda – 2 points
Team Giraffe – 0 points
20. Question:
Find the team that had scored approximately the average of all the points scored by the teams.
Team Phoenix
Team Lion
Team Dolphin
Team Eagle
Answer: 3
The total points scored by all teams is:
27 (Phoenix) + 18 (Tiger) + 14 (Falcon) + 10 (Lion) + 8 (Dolphin) – 9 (Wolf) + 5 (Eagle) + 4 (Bear) + 2 (Panda) + 0 (Giraffe) = 79
The average points would be the total points divided by the number of teams (10):
Average points = 79 ÷ 10 = 7.9
So, the average points scored by all teams is 7.9.
Team Dolphin with 8 points is the closest to the average of 7.9.
Therefore, Team Dolphin scored approximately the average of all the points scored by the teams.
Hence, the third option is correct.
21. Question:
Find the number of games drawn by Team Eagle if they had won 3 games and lost 5 games.
2
3
4
1
Answer: 4
If Team Eagle won 3 games and lost 5 games, we can find the number of games drawn by subtracting these wins and losses from the total number of matches they played.
In the round-robin format, each team plays against every other team exactly once. Since there are 10 teams, each team plays 9 matches.
So, Team Eagle played a total of 9 matches, and they won 3 games and lost 5 games. To find the number of games drawn:
Number of games drawn = Total matches – Wins + Losses
Number of games drawn = 9 – (3 + 5)
Number of games drawn = 9 – 8
Number of games drawn = 1
Team Eagle drew 1 game.
Hence, the fourth option is correct.
Direction:
Study the given radar graph and answer the following questions.
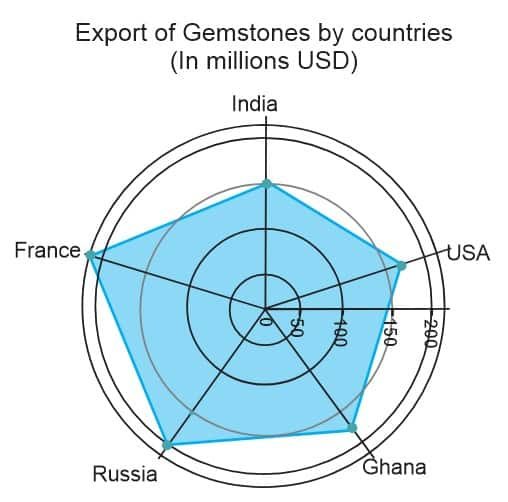
22. Question:
Find the mode of the exports.
$150 million
$180 million
$200 million
None of the Above
Answer: 4
The mode of exports is the export value that appears most frequently in the dataset. To find the mode, we can analyze the provided export values:
Export of Gemstones in India: $150 million
Export of Gemstones in USA: $175 million
Export of Gemstones in Ghana: $180 million
Export of Gemstones in Russia: $200 million
Export of Gemstones in France: $210 million
In this dataset, there is no single export value that appears more frequently than others. Each export value occurs only once. Therefore, in this dataset, there is no mode for the exports, as there are no repeated values.
23. Question:
Which countries have an export less than the average?
France, Russia
Russia, France
India, USA, Ghana
USA, Russia
Answer: 3
The average export can be calculated as follows:
Average Export = (Total Exports) / (Number of Countries)
From the previous dataset, we have the export values for India, USA, Ghana, Russia, and France:
Export of Gemstones in India: $150 million
Export of Gemstones in USA: $175 million
Export of Gemstones in Ghana: $180 million
Export of Gemstones in Russia: $200 million
Export of Gemstones in France: $210 million
Let's calculate the average export:
Average Export = ($150 million + $175 million + $180 million + $200 million + $210 million) / 5 countries
Average Export = $915 million / 5 countries
Average Export = $183 million
Now, let's identify the countries with exports less than the average ($183 million):
India: $150 million (less than the average)
USA: $175 million (less than the average)
Ghana: $180 million (less than the average)
So, the countries with exports less than the average are India, USA, and Ghana.
Directions: The following Line Graph depicts the Mark-up percentage and the Discount percentage of six types of hand-woven Murshidabad-silk sarees A to F at a Tantuja Store in Kolkata, the West Bengal government handloom and silk saree shop.
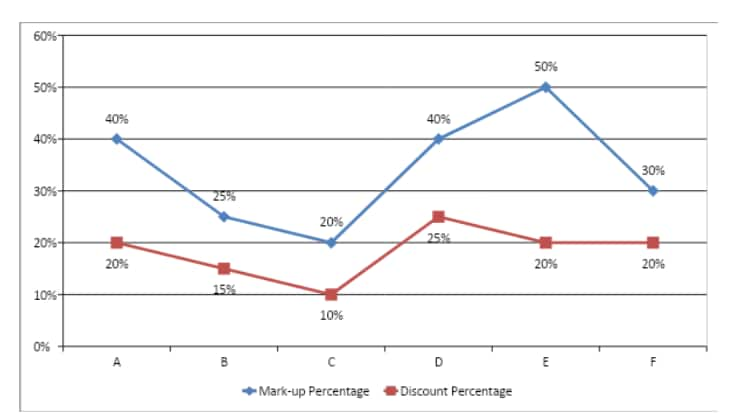
24. Question:
What is the ratio of the cost price and the selling price of Murshidabad-silk saree type D ?
20:21
19:21
21:22
19:22
Answer: 1
From the graph,
For Murshidabad-silk saree type D, marked price is 40% over cost price, and discount is 25% on marked price
We know that If profit percentage is p, mark up percentage is m and discount percentage is d, then
p = m – d – (m*d)/100
Hence profit percentage on saree type D = 40 – 25 + 40(–25)/100 = 5%.
So if the cost price is 100, the selling price should be 105.
Hence, the ratio of the cost price and the selling price of Murshidabad-silk saree type D
= 100 : 105
= 20 : 21.
25. Question:
The ratio of the selling price of Murshidabad-silk saree types C and D is 3 : 4.
Quantity A : The percentage by which the cost price of saree type D is more than the cost price of saree type C.
Quantity B : 30%
A = B
A > B
A < B
Cannot be determined
Answer: 2
Profit percentage on saree type C
= 20 – 10 + 20(–10)/100
= 8%.
Profit percentage on saree type D = 5% (found in previous question).
If the cost price of saree type C is 100x, then selling price of saree type C is 108x.
If the cost price of saree type D is 100y, then selling price of saree type D is 105y.
Thus,
108x/105y = 3/4
or, x/y = 35/48
or, the ratio of cost price of saree type C and D = 35/48
Hence, the percentage by which the cost price of saree type D is more than the cost price of saree type C
= {(48–35)/35}*100
= 37%
Hence A > B
For more practice and in-depth explanation of various CAT DILR questions, click here: Download Now
We have given the topics which are in the syllabus of Data Interpretation and logical reasoning. Students must ensure to prepare them properly in order to gain confidence and boost their scores in this section.
Topics |
Tables |
Bar Graphs and Line Graphs |
Pie Charts/Doughnut Charts |
Radar Chart |
Gantt chart |
Data Arrangements |
Word Puzzle |
Games and Tournaments |
Math Puzzles |
Venn Diagrams |
Binary Logic |
Scatter Plot |
Cubes |
Make sure you are familiar with the different types of questions asked, such as bar graphs, pie charts, etc. This will help you determine the right approach to solve a question.
It is very important to get your basics clear. You should be well-versed in the concepts of percentages, ratio and proportion, etc. as well as calculation shortcuts to save time.
Read the directions carefully. Large questions may seem complex at first glance, but if you break them down into smaller parts, then you’ll be able to identify the method you need to solve the question.
Improve your speed and accuracy by practicing questions from sample papers and previous years’ papers. The DILR section can be time-consuming, so make sure you practice extensively.
The Quantitative Aptitude (QA) section of CAT 2025 tests a candidate's mathematical ability and conceptual knowledge. Spanning from elementary arithmetic to higher-level algebra and geometry, this section requires speed as well as accuracy. Click on the link below, you will get a range of CAT QA sample questions with solutions that have been framed to match the difficulty level of the exam and assist you in gaining confidence through regular practice.
The Verbal Ability and Reading Comprehension (VARC) section in CAT 2025 examines the control over the English language, comprehension, and verbal reasoning ability of a candidate. It includes reading passages, grammar, sentence arrangement, and summary-based questions. This below link brings to the students a collection of CAT VARC sample questions along with a clear solution that assists aspirants to improve reading speed, precision, and verbal abilities as a whole.
TITLE | STUDY LINKS |
ANALYTICAL PUZZLES SET 1 | |
ANALYTICAL PUZZLES SET 2 | |
BAR GRAPHS SET 1 | |
BAR GRAPHS SET 2 | |
BINARY LOGIC SET 1 | |
BINARY LOGIC SET 2 | |
BLOOD RELATIONS SET 1 | |
BLOOD RELATIONS SET 2 | |
CASELETS SET 1 | |
CASELETS SET 2 | |
CUBES AND DICING SET 1 | |
CUBES AND DICING SET 2 | |
DECISION MAKING SET 1 | |
DECISION MAKING SET 2 | |
GAMES AND TOURNAMENTS SET 1 | |
GAMES AND TOURNAMENTS SET 2 | |
INNOVATIVE GRAPHS SET 1 | |
INNOVATIVE GRAPHS SET 2 | |
LINE GRAPHS SET 1 | |
LINE GRAPHS SET 2 | |
LINEAR AND CIRCULAR ARRANGEMENT SET 1 | |
LINEAR AND CIRCULAR ARRANGEMENT SET 2 | |
LOGICAL DEDUCTIONS AND CONNECTIONS SET 1 | |
LOGICAL DEDUCTIONS AND CONNECTIONS SET 2 | |
ORDERING AND SEQUENCING SET 1 | |
ORDERING AND SEQUENCING SET 2 | |
PIE CHARTS SET 1 | |
PIE CHARTS SET 2 | |
RADAR GRAPHS SET 1 | |
RADAR GRAPHS SET 2 | |
REASONING BASED DI SET 1 | |
REASONING BASED DI SET 2 | |
ROUTES AND NETWORKS SET 1 | |
ROUTES AND NETWORKS SET 2 | |
SCATTER GRAPHS SET 1 | |
SCATTER GRAPHS SET 2 | |
SELECTIONS AND DISTRIBUTIONS SET 1 | |
SELECTIONS AND DISTRIBUTIONS SET 2 | |
SYLLOGISM SET 1 | |
SYLLOGISM SET 2 | |
TABLE BASED DI SET 1 | |
TABLE BASED DI SET 2 | |
VENN DIAGRAMS SET 1 | |
VENN DIAGRAMS SET 2 |
Frequently Asked Questions (FAQs)
DILR full form is Data Interpretation and Logical Reasoning. This section of the CAT exam tests a candidate’s analytical thinking and data comprehension skills.
MCQs and TITA (non-MCQs) are the two different types of questions asked in the CAT DILR section.
The Data Interpretation questions are asked in the form of sets. For example in the CAT 2023 examination, the DILR section had 4 sets with 5 questions. Each set would generally be of variable difficulty.
Critical and decision-making skills are the two most important skills required for solving the CAT DILR section.
Clocks and Calendars, Blood Relations, Statements, Venn Diagrams, Series, Data Arrangement, Propositions, Data Structure, Family Trees, Tables, Direction Sense, Pie Charts, Coding-Decoding, Binary Logic, Seating Arrangements, Assumptions, Data Sufficiency, Bars & Line Graphs, Puzzles and Sets & Caselets.

On Question asked by student community
Hello Dear Student,
An SC rank of 82 in a Common Entrance Test (CET) is highly competitive and typically guarantees admission into top-tier state universities, central universities, or highly-ranked private institutions. Whether a specific seat is currently available depends directly on the exact university's counselling schedule. Many institutes require you
Hello Dear Student,
With a score of 265, securing a B-Category (Management)
MBBS
seat is highly competitive, but not entirely impossible. Closing scores for these seats typically fall between 225 and 350, depending on the state and college. Waiting for the mop-up round can sometimes lower the cutoff as unallocated
If by OC you mean Open Category/General category in India, and you have 95%+ throughout your academics (Class 10, Class 12, and graduation) , then your CAT percentile target depends on the B-schools you're aiming for.
Here's a general guideline:
| Target B-school | Safe CAT Percentile (General Category) |
|---|---|
| Indian Institute of |
Hello,
Getting an MBBS seat in Karnataka with 460 marks is quite difficult, even if you belong to Category 1, Ex-serviceman, and HK category in government colleges. However, you have a good chance of getting a seat in the private medical colleges through the government-quota seats in private medical colleges.
Hello Dear Student,
Yes, you have a very strong chance of securing a 'Category-A' (convenor quota) BDS seat at the Panineeya Institute of Dental Sciences in Hyderabad with 377 marks.
You can check, find and access more information here:
https://medicine.careers360.com/articles/re-neet-2026-safe-score-for-bds
Hope it helps!
Directions for question:
The bar-graph given below shows the foreign exchange reserves of Nepal (in million Rupees) from 2014 to 2021. Answer the following questions based on the graph :

Question:
What was the percentage increase (rounded to the nearest integer, if deemed necessary) in the foreign exchange reserves in
75+ years of legacy | #1 Entrance Exam | Score accepted by 250+ BSchools
NAAC A++ Grade | AACSB Accredited | 75,000+ Alumni
40 LPA Highest Package | Up to 100% Scholarship worth 24 Crore via GUTS exam
Last Date to Apply: 31st July | Ranked #36 amongst institutions in Management by NIRF | 100% Placement
Ranked among top 10 B-Schools in India by multiple publications | Top Recruiters-Google, MicKinsey, Amazon, BCG & many more.
Application End Date: 24th Jul'26 | AICTE Approved | NAAC A++ | Category 1 University by MHRD | Highest CTC 1.4 Cr LPA from Amazon