Amity University-Noida MBA Admissions 2026
Ranked among top 10 B-Schools in India by multiple publications | Top Recruiters-Google, MicKinsey, Amazon, BCG & many more.


MAT Data Analysis and Sufficiency mock tests help candidates improve speed, accuracy, and problem-solving skills for one of the most analytical sections of the exam. Candidates who solve the MAT Data Sufficiency mock test regularly familiarise themselves with chart-based questions, caselets, and data sufficiency problems. These mock tests also help identify weak areas, improve time management, and build confidence for the MAT 2026 exam.
This Story also Contains

In this article, we provide MAT 2026 Data Analysis and Sufficiency mock tests along with practice strategies to help you achieve exam success.
Candidates can check out the overview of the MAT Data Analysis and Sufficiency section below.
Particulars | Details |
Section Name | Data Analysis and Sufficiency |
Total Questions | 30 Questions |
Difficulty Level | Moderate to Difficult |
Type of Questions | Data Interpretation and Data Sufficiency based MCQs |
Important Topics | Tables, Pie Charts Line Graphs Bar Graphs Caselets Data Comparison Missing Data Data Sufficiency |
The Data Analysis and Sufficiency section will account for 30 questions out of 150 questions in the exam
Earlier, there were 40 questions in the exam, but now it has been reduced by 10 questions
These questions are all objective type MCQ questions with 4 options.
This section is about your ability to predict the answer using the given statements. It requires less time to solve as compared with problem-solving questions. It tests your command of the basics of mathematics. The data analysis and sufficiency section boosts your MAT score as it takes less time, and requires less calculation.
It is a separate section of 30 questions covering 20% of the weightage. Focus on mastering your mathematical concepts to clear this section. Questions in this section may seem big but can be solved in quicker succession with the right strategies and practice.
Proficiency in Data analysis and Data sufficiency is also very essential to deal with real-world business situations which is very important for management roles.
Also read:
Ranked among top 10 B-Schools in India by multiple publications | Top Recruiters-Google, MicKinsey, Amazon, BCG & many more.
Last Date to Apply: 31st July | Ranked #36 amongst institutions in Management by NIRF | 100% Placement
Here we are going to discuss some of the key topics provided in the MAT mock test for Data Analysis and Data Sufficiency.
Data Interpretation questions contain the information in the form of Pie charts, Tables, Bar graphs, Passage, and Line graphs followed by a set of 4 - 5 questions to solve.
Key concepts required to solve data interpretation questions are
Percentage
Average
Ratio
Basic Arithmetic Operations
Here are some examples of questions on data interpretation:
Q1. Direction: Analyse the graph/s given below and answer the question that follows.
Study the following bar graph giving Economic Indices for the period 1961-62 to 2001-02 to answer the question.
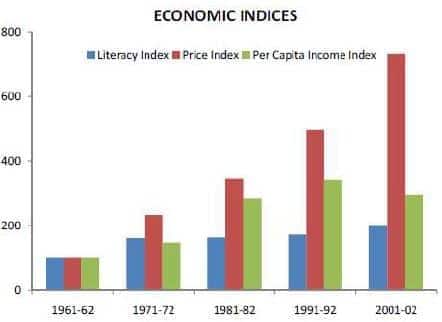
What are the respective indices of literacy, price, and per capita income for 2001-02 taking 1971-72 as the base period?
124.1, 313.8, 200
313.8, 124, 201
313.8, 124.1, 190
124.1, 313.8, 194
Correct Answer:- A
Explanation:-
Literacy index for 2001-02 with 1971-72 as the base period
= (200/161.1) × 100 = 124.1
Price index for the year 2001-02 with 1971-72 as the base period
= (732/233.3) × 100 = 313.8
Per capita income index for the year 2001-02 with 1971-72 as the base period.
= (296 / 148.2) × 100 = 200
Hence, the correct answer is option(A).
Q2. Direction: Answer the questions based on the information given below.
The table given below shows the number of international matches (ODIs, tests, and T20s) played by India against five countries: Australia, England, Pakistan, Sri Lanka and South Africa, during the period 2007-2011, the line chart gives the average runs scored per inning by India against the given countries in the period 2007-2011.
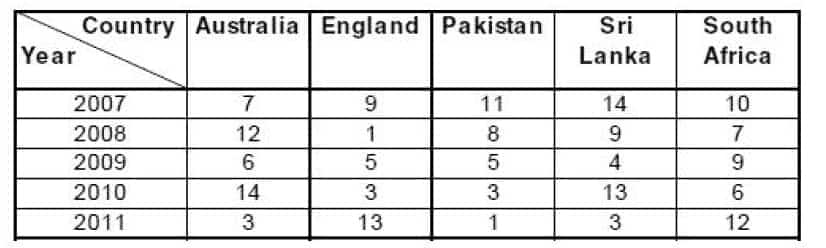
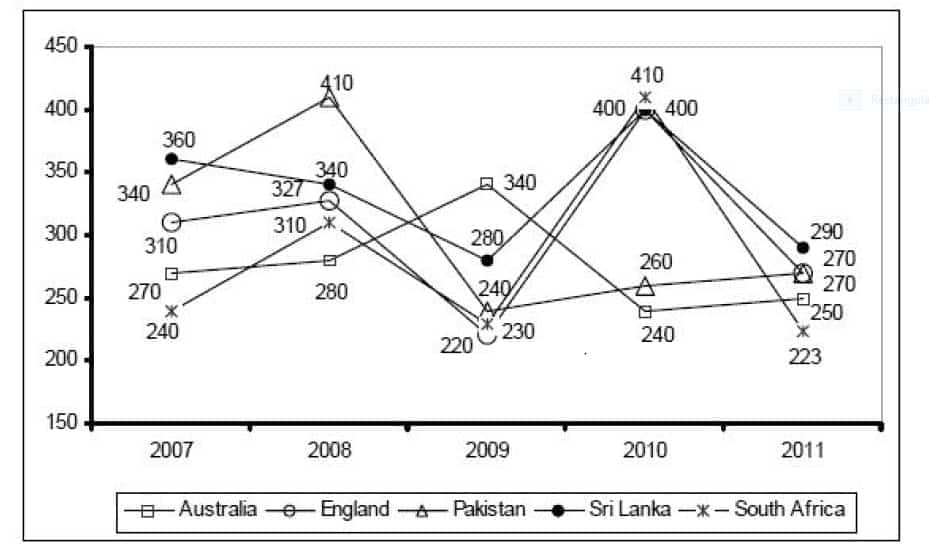
Note: Each ODI and T20 consists of one innings and each test consists of two innings.
Q. Against which of the following countries did India play the maximum number of international matches in the period 2007-2011?
Australia
England
Pakistan
South Africa
Correct Answer:- D
Explanation:-
The number of matches played by India against the given teams in the period 2007-2011 are:
Australia = 42, England = 31,Pakistan = 28, Sri Lanka = 43 and South Africa = 44.
Hence, the correct answer is option (D).
Single statement sufficiency: This type of question provides one statement and students have to check if it is sufficient to answer the question.
Example:
Q. If x2 is greater than y2.
x = 5, y = 3
Two statements sufficiency (independently): This type of question provides two statements. Students have to analyze both statements and decide if either one is sufficient to answer the question.
Example:
Q. What is the circum-radius of a right-angled triangle?
I. The length of the hypotenuse of the right-angled triangle is 13 cm.
II. The perimeter of the right-angled triangle is 100 cm.
Here, statement 1 is sufficient.
Two statements sufficiency (Combined): In this type of question, students have to check if both the given statements need to be used to arrive at the answer.
Example:
Q. In What ratio should pure and adulterated fruit juices be sold to make a profit of 10% by selling the mixture at Rs.14/litre?
Pure juice is sold at Rs. 18 per litre to get a profit of 20%.
Adulterated juice is sold at Rs.15 per litre to get a profit of 25%.
Bar graphs: Rectangular bars with the length of the bar proportional to data values.
Example: Graph to show inflation for companies A, B, C, and D for 2015 and 2016.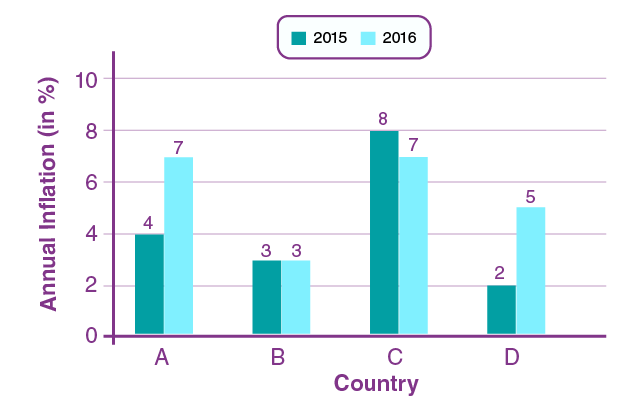
Line graphs: Showing trends over time by plotting points connected by a line.
Example: Graph to show revenue for companies X, Y, and Z from 1993 to 1999.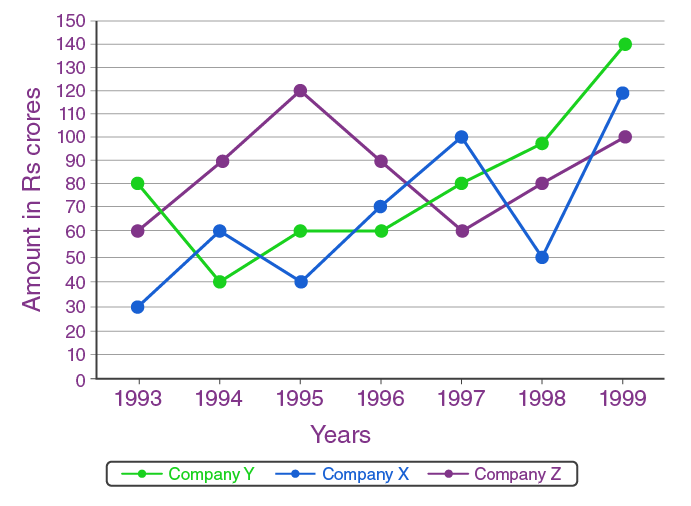
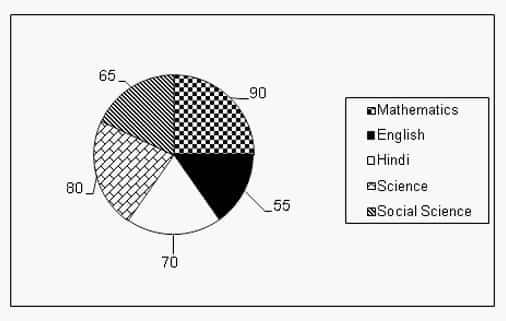
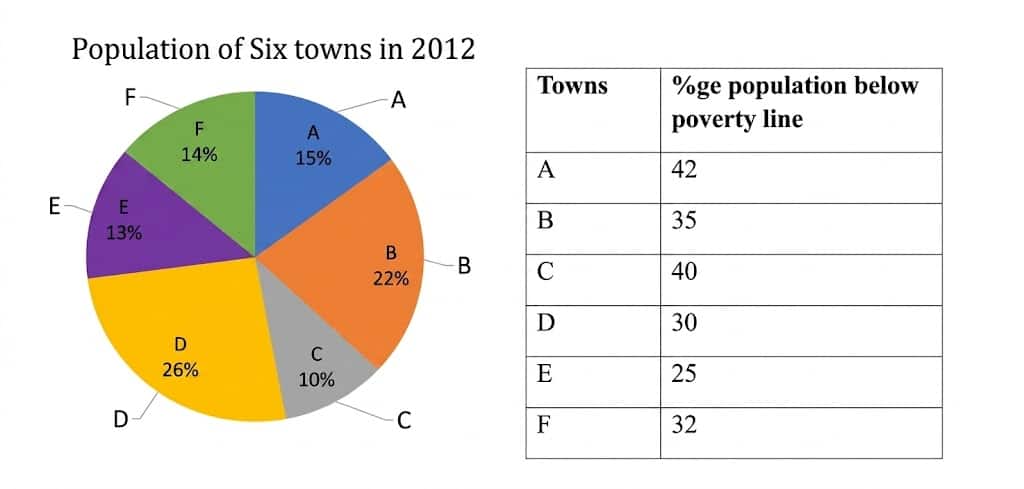
Pie charts: A circle sliced into many parts with every part proportional to different categories distribution in total.
Example: Pie- Chart represents the number of students who passed in 5 different subjects.
Tabular data: Data presented in rows and columns.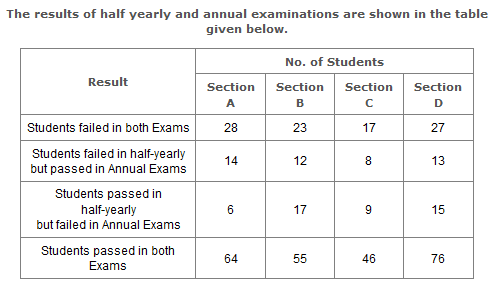
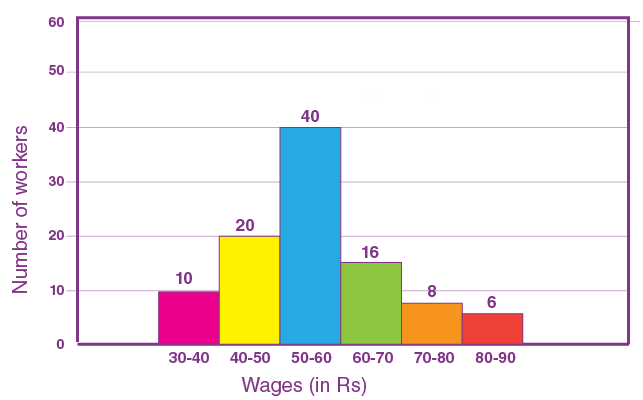
Histogram: Similar to the bar graphs but often used to show frequency.
Example: The graph below shows the distribution of workers in terms of wages per day.
Venn diagrams: Overlapping circles to represent different sets.
Example: Distribution of the number of students who appeared in different exams

Combination of charts: A combination of two graphs, often combining bar and line graphs.
Example: The pie chart shows the population of six towns in 2012 whereas the table shows the percentage of the population below the poverty line in six different towns.
Know about the benefits of attempting MAT 2026 Data Analysis and Sufficiency mock tests:
Here are some MAT exam Data Analysis MAT preparation tips that will help students approach this section in a better way.
Let's take an example to better understand how to approach the DI section.
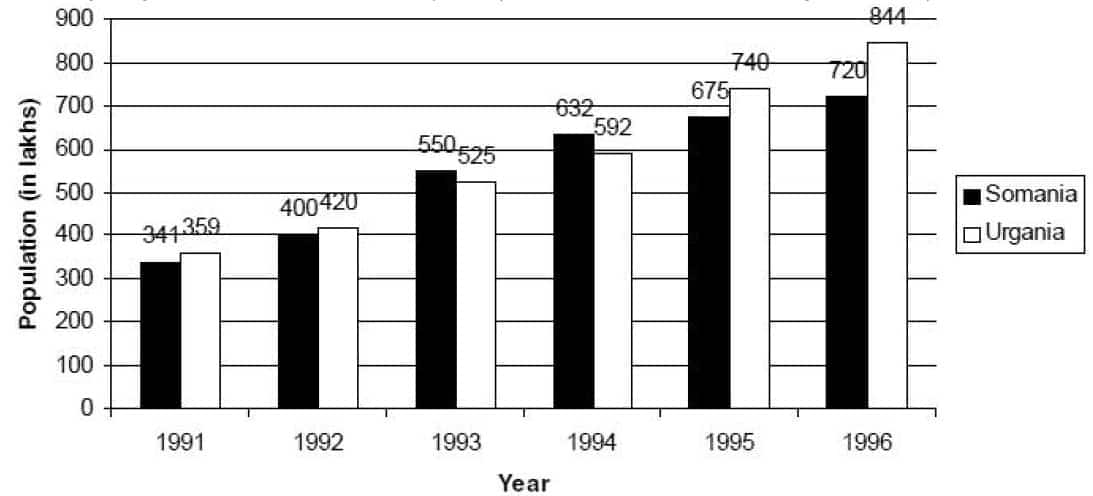
The bar graph given below shows the population(in lakhs) of two countries and Urgania for six years from 1991 to 1996.
We have to find if the percentage increase in the respective population of the two countries in 1997 over 1996 is the same as that in 1993 over 1992, then what is the total population of the two countries in 1997?
First, understand the data given in the bar graph.
Write down the data for the years 1992 and 1993
It is said that the percentage increase from 1996 to 1997 is the same as the increase from 1992 to 1993.
For Somalia: 1992 - 400
1993 - 550
For Urgania: 1992 - 420
1993 - 525
Find the percentage change from 1992 to 1993
Let's calculate the increase in population in both countries from 1992-93.
For Somalia: 550 - 400 = 150
Percentage increase for Somalia = (150/400) × 100 = 37.5%
For Urgania = 525 - 420 = 105
Percentage increase for Urgania = (105/420) × 100 = 25%
Apply the same percentage change to the values of 1996 to find the values for 1997
Now we will calculate the population of both countries in 1997 using these percentages.
So in 1997, population of Somalia = 720 × (137.5/100) = 990
Population of Urgania = 844 ×(125/100) = 1055
So total population is 990 + 1055 = 2045
Make sure you have used the correct values to calculate.
In Data sufficiency questions, you do not need to do the full calculation. You have to determine if the statements are sufficient to get the answer. So read the question carefully and understand what is being asked. Then first check the statements independently if they are sufficient on their own. After that check if both statements are combiningly required to answer the question. Do not assume any other data points on your own and only focus on the given data.
Misinterpretation is the most common mistake in the MAT Data Analysis test. Do not rush through questions.
Shortcuts are useful for quick calculation but only use proven shortcuts to solve questions.
Do not overspend time on one question. Move on to the next question.
Analyze the key points of the questions before calculating them to avoid any kind of confusion.
We have provided below the direct link to access the MAT 2026 free mock test:
Click here to attempt: MAT 2026 Mock Test
The data analysis section is a high-scoring section if you practice well. Students attempt lots of MAT practice tests for Data Analysis to perform better in this section.
Here are the benefits of online mocks in Data analysis.
You will get an excellent idea about the topics and difficulty level of the questions that are asked in the exam.
You can strategize time management techniques like shortcuts and tricks.
You can take these mocks anytime anywhere at your own convenient time.
These platforms provide immediate feedback with a detailed analysis of your performance. You can check and rectify your mistakes.
Reviewing your performance in the mock tests is necessary for identifying the stronger and weaker areas during preparation.
It is very important to track your accuracy during the mock tests. Also, check if your time management strategies are working or not.
Accuracy can be calculated by dividing your correct answers by the total number of questions.
Here are some tips which will be helpful in this case.
Note down the number of attempted questions and the number of correct answers for 5 mock tests in a row. If the accuracy gradually increases, you are on the right track.
Some online platforms compare your time of answering a question with the topper's time. Check the difference between those times and try to finish the question within that time.
Set a time limit for each type of question and after the test check how much more time you take than the allotted time.
After checking time-consuming areas in mock tests, practice some topic-wise tests to manage your time in those specific types of questions without the distraction of other sections.
The common mistakes in this section are:
Misinterpretation of the graphs
Calculation errors
Misunderstanding the questions
After the mock tests, identify which type of mistakes are happening more frequently.
Then to solve those mistakes:
Focus on section-wise practice for topics like bar graphs, pie charts, and line graphs to interpret the data better and faster.
During the calculations, do not skip important steps. This often leads to calculation errors.
Do not rush through questions. Understand them first, then approach the questions.
Your target should be not repeating those same mistakes during the actual exam.
Many platforms provide detailed solutions. Learn from them and choose the best way to solve those questions.
You can not increase speed and accuracy at the same time. Focus on accuracy first and set goals like increasing accuracy to 5-10% after each topic-wise exam. When you are familiar with all the topics and solving methods, then the speed will automatically increase during full mock tests.
After each mock test, set a score higher from the present score and try to achieve it. This will ensure steady improvement over time.
The previous year’s MAT Data Analysis and Sufficiency Sample Paper plays a crucial role in the preparation for the exam.
The structure of the MAT 2026 sample papers replicates the actual exam pattern containing questions from tables, charts, graphs, caselets as well as Data Sufficiency questions. These questions test your logical reasoning and mathematical skills.
The difficulty levels of these sets vary from easy, to moderate to difficult questions. Some of the questions may be straightforward, but some of them need critical thinking and attention to detail.
Previous year's questions give you an idea about the pattern of the exam and common topics that are frequently asked in the Data Analysis and Data Sufficiency section.
Solving these papers will help you understand what you need to practice more and in which sections you are already strong.
Regular practice of past papers helps to interpret and process the data faster with much improved accuracy.
Sample papers from reliable sources are often modelled closely following the actual MAT exam format and the latest MAT 2026 syllabus. So solving these sets will allow you to be more comfortable during the actual exam.
The difficulty levels of these sets can sometimes be slightly easier, sometimes more challenging than the actual exam.
This variety will help you to be equipped for any type of Data Analysis and Data Sufficiency question that comes your way on the exam day.
Making a viable strategy for the MAT exam is always necessary. Here are the names of some of the best MAT books for Data Analysis preparation.
Book/Resource | Author/Platform | Overview of Content | Topics/Areas Covered | Special Features & How to Use |
Data Interpretation for CAT | Nishit K. Sinha | Popular book for developing DI concepts and analytical skills | Tables, bar graphs, pie charts, caselets, line graphs | Practice timed sets regularly to improve interpretation speed and accuracy |
Quantitative Aptitude Quantum CAT | Sarvesh Verma | Advanced aptitude and DI preparation resource | Data sufficiency, arithmetic DI, logical DI sets | Useful for learning shortcut methods and advanced problem-solving approaches |
How to Prepare for Data Interpretation for CAT | Arun Sharma | Concept-focused DI preparation book with graded exercises | Charts, graphs, missing data sets, caselets | Start with basic exercises and gradually move to advanced level questions |
A Modern Approach to Logical Reasoning | R.S. Aggarwal | Helpful for strengthening analytical and logical reasoning skills | Data sufficiency, logical reasoning, arrangements | Good for beginners to build concepts and practice question varieties |
Here are some pieces of advice which will help you to handle advanced data analysis and data sufficiency questions more effectively.
In the MAT exam, often multi-layered questions from this section feature and confuse students. These questions generally involve multiple charts, tables, or graphs.
Practice solving these types of problems after strengthening your basic concepts.
In complex problems, identifying key data points, trends and patterns is essential to solving these problems quickly. Consistent practice will help you catch these concepts easily in your brain.
High level Data Sufficiency problems, test the abilities of students to reason with limited information. Remember you do not have to calculate the whole question. You have analyzed if the provided data is sufficient to arrive at a unique answer.
If the problem is big, break it down into smaller halves and analyze it step by step.
Avoid making assumptions in these high-level Data sufficiency questions. Practice these types of problems more to answer the question only from given data.
Performing well in mock tests will boost your confidence for the exam.
Timed mock tests also help you to get familiar with actual exam settings. This will help you to answer complex questions without hesitation and manage time efficiently.
Advanced-level practice will also build your stamina for the actual exam. Solving these problems during mock tests will help you to be less pressured and more confident during the exam.
Attempting the MAT Data Sufficiency practice test regularly will improve your logical skills.
The objective of Data sufficiency questions is to check if the data is sufficient. Long calculations and full solutions to the question are often not needed.
Generally, in a Data Sufficiency question, the question is followed by two statements and we have to check if they are sufficient or not to get the answer.
What to do:
Analyze both statements independently to check if they are alone sufficient to get the solution to the question.
Avoid assuming data points on your own and getting confused.
If a statement is insufficient, mark it and move on to the next statement.
Sometimes both statements complement each other. Check if both statements are required combined to get the answer.
Also, sometimes neither statements alone nor together will be sufficient to get the answer.
If the statements are long, break them into smaller parts and analyze them separately.
It makes your job easier to check if they are sufficient or not to get the answer.
If a statement doesn't make sense after first reading, read it again.
If the question involves geometric data, use diagrams to visualize the information better.
If the question involves technical or seemingly complicated terms, do not panic. Try to understand what the statement is truly asking. If it takes too much time, skip that question and return to it at the end of the exam.
A data sufficiency question contains five options.
Statement 1 is sufficient.
Statement 2 is sufficient.
Both statements together are sufficient.
Each statement alone is sufficient.
Neither statement is sufficient.
To eliminate incorrect options, you should do:
Analyze the first statement on its own to check whether it contains enough information to answer the question. If it does, you can eliminate any answer choices that imply additional information is needed.
Analyze the second statement on its own, without considering the first statement's sufficiency. If the second statement itself is able to find the answer, eliminate the options that fail to recognize its sufficiency.
By systematically assessing each statement, you effectively can eliminate some answer choices that improve both clarity and accuracy in your decision-making.
Data Analysis and Data Sufficiency section is crucial to achieve a higher overall score. This section is considered to be the easiest among all the sections.
This section carries 20-25% marks of the total MAT exam.
Since this section involves objective reasoning, candidates consider this as a high-scoring section.
This year the pattern has changed. There will be a total of 30 questions in this section. So expect 22-23 questions from the Data Analysis section and 7-8 Data Sufficiency questions.
Scoring high in this section will have a positive impact on the overall percentile of the exam. Students often struggle with time management and interpreting complex data in this section.
Candidates aiming for 95+ percentiles should focus on excelling in this section to maximize their scores.
Some institutes consider sectional cut-offs. So achieving a good score in this section will increase your chances of getting selected for a top B-school.
MAT exam consists of five sections with 30 questions each with no sectional time limit. The total time limit is 150 minutes.
Data analysis section is often considered easy to score but time-consuming. So allocate 20-25 for this section beforehand.
Unlike some of the other sections, Data analysis can be mastered with consistent practice. Focus on accuracy during the mock tests. Speed will gradually increase with time.
This section demands more concentration to save time. So avoid panicking if you get a complex question. Just skip that question and try other questions which seem familiar and easy.
Here are some tips from experts and toppers which will help in your preparation for the MAT exam in the Data Analysis and Data Sufficiency section.
Experts always stressed allocating time limits for each question during preparation. Spend 1-1.5 minutes per question in the Data Analysis and Data Sufficiency section. If the question is simpler, then solve it within 1 minute. For complex questions, invest a maximum of 2.5 minutes.
Always attempt easier and more familiar questions first. Then try to solve complex problems. Do not waste your time on one difficult question and skip to the next question.
Analyzing graphs and tables with concentration is the key to solving these questions quickly. Rushing through these questions is not necessary.
Often these graphs and tables contain irrelevant information. Read the question also and focus only on relevant data points.
Sometimes skimming is the best option to get an overall sense of the data being presented.
Eliminate the wrong options first and review the other options to get the answer.
In complex calculations, use approximation and estimation techniques to arrive at a near-accurate answer.
Focus more on mental calculations rather than using pen and paper for short calculations.
Remember multiplication tables, squares and cubes of numbers up to 20.
Identify obvious patterns and trends during the interpretation of charts or graphs to eliminate wrong options.
Use the approximation method during long calculations and adjust the values at the end.
Also, memorize these mathematical formulas for quick calculation.
Topic | Formula |
Average | The sum of n observations / n |
Weighted average | The sum of the weighted terms / Total number of terms |
Profit percentage | [(Selling price - Cost price) / Cost price] × 100 |
Loss percentage | [(Cost price - Selling price) / Cost price] × 100 |
Discount percentage | (Discount amount / Marked price) × 100 |
Percentage change | [(New value - Old value) / Old value] × 100 |
Simple interest | (Principal × Time × Rate of interest) / 100 |
Amount if interest is compounded | Principal (1 + rate/100)Time |
Ratio | Value of A / Value of B |
Proportion when comparing two ratios | A / B = C / D |
Time-Speed-Distance | Speed = Distance / Time |
Average speed | Total distance / Total time |
Careers360 offers helpful MAT 2026 eBooks that you can download in PDF format. These eBooks include tips for each section, the latest exam pattern, solved questions, and sample papers. If you're looking for MAT books PDF download options, this is a good place to start. The content is easy to understand and useful for anyone preparing seriously for the MAT exam.
Title | Download Link |
MAT Sample Paper 2026 | |
MAT 2026 Preparation Tips, Study Material, Sample Paper & Mock Test | |
MAT Previous Year Solved Paper |
Frequently Asked Questions (FAQs)
These are topics from which most of the questions in the Data Analysis section come.
Tabular data
Bar graphs
Line graphs
Pie charts
Caselets
Combined graphs
Understand the question and concentrate on what is needed to answer the question.
Some of the basic mathematical skills required for solving Data Sufficiency MAT test questions are:
Basic arithmetic and algebra
Some geometry formula
Set theory and Venn diagram for questions involving groups, categories, and overlaps.
Ratio & Proportion and percentages
It’s recommended to attempt at least 5–7 full-length mock tests and 10–15 sectional tests to identify weak areas and strengthen your problem-solving skills.
After each test, review incorrect answers, calculate time spent per question, identify recurring mistakes, and revise the related concepts to improve performance in future tests.
Unlike the CAT or XAT exam, the difficulty level of MAT questions is easy to moderate. Some questions can be tricky or difficult but most of them can be solved if you have practiced strategically.
Data Analysis and Data Sufficiency section is considered high-scoring but time-consuming.
Master concepts like percentages, ratios, averages and logical reasoning to attempt maximum questions accurately in this section.

On Question asked by student community
Hi Arushi,
Please refer to this article link
https://school.careers360.com/articles/nmms-question-papers
And Sample Papers link https://school.careers360.com/download/nmms-sample-papers-previous-years
Hope it helps you :)
Hello Aspirant,
With a MAT percentile of 96.05, you may have good chances of admission in colleges such as BIMM Pune , IPE Hyderabad , Jaipuria Institute of Management , FIIB Delhi , NDIM Delhi and several other reputed MBA institutes accepting MAT scores.
Admission availability varies across institutes. It
Hello Dear Student,
You can check, find and access more information here:
https://school.careers360.com/articles/nmms-result
Hope it helps!
Hello Dear Student,
Yes, the Karnataka PGCET MBA 2026 examination is scheduled to be held on June 14, 2026. If your MAT CBT exam is also scheduled on the same date, there is a scheduling conflict between the two examinations. In such a situation, candidates should regularly check the official
Hi,
The NMMS result is out and you can check it through the following link https://school.careers360.com/articles/nmms-odisha-result
All the best!
75+ years of legacy | #1 Entrance Exam | Score accepted by 250+ BSchools
NAAC A++ Grade | AACSB Accredited | 75,000+ Alumni
40 LPA Highest Package | Up to 100% Scholarship worth 24 Crore via GUTS exam
Last Date to Apply: 31st July | Ranked #36 amongst institutions in Management by NIRF | 100% Placement
Ranked among top 10 B-Schools in India by multiple publications | Top Recruiters-Google, MicKinsey, Amazon, BCG & many more.
Application End Date: 24th Jul'26 | AICTE Approved | NAAC A++ | Category 1 University by MHRD | Highest CTC 1.4 Cr LPA from Amazon